Master your debugger
I’ve met pretty big bunch of people during my studies and I’ve realized that many of them did not use debugger when problem had encountered. Not that it’s my business to tell anyone how to solve his bugs. Printing out variable dumps or debug messages can be pretty fast, but for extensive problem solving is debugger necessity which can save you hours.
Then I thought for a while and realized, that noone really teaches you how or why to use debugger. Not even at school which is really a shame. In this blogpost I’ll get through debuggers for web developers - in IDEs and in the browsers. Post is not about getting deep, but it provides useful links where you can get to know more. So let’s dive into it.
Basics
The basic concept of debugger is to pause execution of code in the very place you want at. The debugger always pauses before execution of code on line you selected. When you get there, you have couple of options which all debuggers provide by default:
- List all local/scope variables and their values.
- Add watch for any variable, method call, expression. If it’s valid, it gets evaluated within debugger and you see return value immediately without affecting the execution.
- Change value of variable (optional). Some debuggers allow you to change value of variable while debugging so you don’t have to restart execution every time you want to change the value of variables.
- Step over to next call. If your method contains 3 calls and you are paused on the first, this will execute the first call and move debugger to next one.
- Step into. If you want to know what’s happening within the call, this option will dive you into it and you’ll appear inside the method. You can see it’s scope variables and go again step by step to see what’s happening.
- Step out. If you don’t want to wait until return statement, this will effectively finishes execution of method you are in and pushes you one step up in call stack.
And this is it. This is basically everything that debugger is. Couple of simple features that make printing out help messages to console pretty ancient. If you are still deciding whether to use advanced text editor (Sublime, Emacs) or IDE, debugger is one of the killing features which will make deciding one sided.
IDE debugging (by JetBrains)
To present debugger in IDE, I chose IDE by JetBrains as they provide IDEs for almost all popular languages related to web development. For standalone application development in C++ I encourage you to try Microsoft Visual Studio - Express Edition is free and it has one of the most advanced debugger I ever used.
I’m going to present two use cases. First is simpler scenario with local Ruby project developed in RubyMine. Then I’ll show something advanced with PHPStorm and remote development.
RubyMine
Debugging Ruby is pretty simple and it doesn’t matter whether it’s just your small script or complex Ruby on Rails application. First you need to place your breakpoints at places you want your code to be paused - clicking on the vertical bar left to your code will do the trick. Also CTRL+F8 is pretty handy shortcut for toggling breakpoint for line you’re currently at.
When you’re ready, start your application in debug mode (run - debug in menu, SHIFT+F10 as a keyboard shortcut and there’s also green bug icon next to the regular play icon in the toolbar). If you’re running the script, it should get there automatically. If you run Rails application, refresh the view which should trigger the breakpoint.
If you develop Rails project and run your debugger for the first time, RubyMine asks you to install debugger gem. This is mandatory and you can’t debug Rails application without it. It’s just one time thing so it won’t bother you again next time.
I’m not going to bother you with all the information when someone did it already better. Go and check RubyMine’s tutorial on how to use their debugger and use all the best features of it.
PHPStorm
Debugging PHP is a bit harder than Ruby. First you have to set up xdebug extentsion on your PHP web server. There are many tutorials on the web how to install it (standalone, for LAMP, for WAMP..) so I won’t cover it in this tutorial. I recommend you to go visit official documentation and read through it.
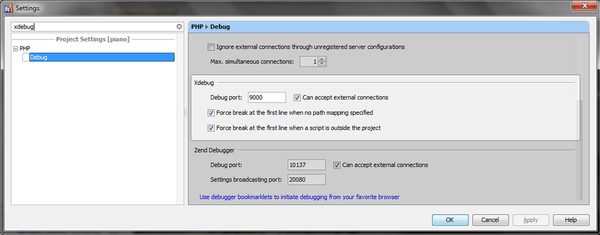
When you are ready, let’s get to PHPStorm and setup everything else. As I said earlier, this part of tutorial will show you how to do debugging on remote server. Expecting that you enabled xdebug on that remote server, now you need to check PHPStorm settings whether they match settings on the server. The most important is listening port, everything else is up to you. You can find the setting in PHPStorm settings and filtering keyword xdebug.
Now some magic in the browser. JetBrains allows you to have debugging cookies which will tell IDE whether you want to debug or not. To allow debugging in your browser on selected domain, there are bookmarklets which you can add as bookmarks and run them when the site you want to debug is opened.
When everything is ready, in PHPStorm go to Run - Start listening PHP debug connections or just simply press green earpiece icon in the toolbar. Place your breakpoint now, go back to the browser and refresh the page. What you should see now is path mapping between your local files (e.g. /data/web/blog) and real path of files on the remote server (e.g. /usr/share/www/blog). You need to tell PHPStorm/Xdebug where it should look for source codes on the remote server. It probably already did path to index.php for you, all you need to do is do the same for the root of your project and for the any external libraries you want to have included in your debug sessions.
You’re done now and everything should work. I recommend you to check Xdebug installation guide for PHPStorm by JetBrains, which will lead you step by step if you still have any issues and these Ukrainian slides, which contain screenshot of every important view you will need to see and set up. JetBrains also recently made a blogpost and a screencast about debugging, I recommend you to check them as well.
Chrome Developer Tools
Google Chrome and its developer tools contain great tool for debugging JavaScript, CSS and HTML (with DOM manipulation). You can open developer tools by pressing F12, CTRL+SHIFT+I or via Inspect element option in context menu. Let’s split the features up a bit.

HTML/CSS
For HTML debugging, you’ll only use left side of elements tab. First, Inspect element option in context menu reveals hovered element in DOM tree. This DOM tree is real state of representation and differs with View source code. After you have selected element you want to work with, you can see all its ancestors in the status bar of developer tools (very bottom).
By right-clicking element in DevTools you get couple of handy options:
- Add/edit attribute of element. Options is not limited in any way and you can add basically any attribute you want.
- Edit element as HTML. This allows you to change attributes as well as text content of element, so you can see how your new content looks like without refreshing the page.
You can also drag'n'drop element anywhere in DOM and see how rearranging elements affect what browser renders.
To style your content, use right pane of elements tab. You can see what rules apply for selected elements, edit and create new styling options, force state of element to see how hovered version of it looks like etc. Developer tools provide autocomplete when you press CTRL+SPACE - when you go through the options, you can see the difference realtime, so even beginner can try new things and learn how they work.
Many I have not mentioned, but everything (with fancy gifs) is amazingly explained in the documentation of Chrome DevTools and you can check out my slides about developer tools from Webelement meetup.
Javascript
Debugging javascript is very similar to what I mentioned earlier in IDE section. You’ve got the code which is being executed and you want to pause it.
First open your developer tools and switch to sources tab. There are three very important keyboard shortcuts I want you to know before we proceed, mostly because they bring IDE-like feeling when debugging:
- CTRL+O. Opening file.
- CTRL+SHIFT+O. DIsplaying specific function of file.
- CTRL+SHIFT+F. Search in any resource which has been loaded.
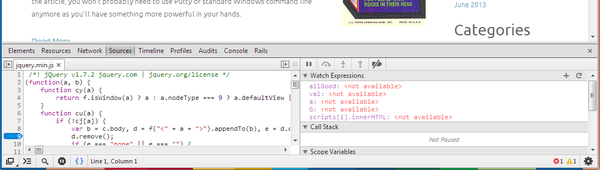
Now when you open any file containing javascript, process is simple. Place your breakpoint on the specific line by clicking on the line number, refresh the page if needed and watch/play with your variables in the right pane of developer tools. You can find more about debugging javascript in the documentation (things such as event breakpoint, more handy shortcuts, pretty print of minified JS and more).
Taking one step further, going NodeJS
As you maybe thought, NodeJS is javascript too. So if Chrome DevTools are for frontend debugging, what to use for backend debugging? It’s DevTools again. Chrome’s developer tools are just a web app and you can get even to the state, where you use dev tools to debug dev tools. Nasty, huh?
Anyway, to debug NodeJS application you need to do two things:
- start NodeJS server with –debu *parameter
- start node-inspector (install it globally from npm if it is not installed yet: sudo npm -g node-inspector)
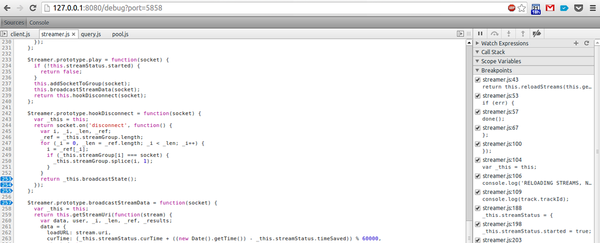
When you’re ready, visit the page node inspector printed out and it will get attached to your running NodeJS instance. Place your breakpoints like you did in Chrome DevTools and wait until execution goes through them. Everything else is just the same. You can read more at node-inspector GitHub page.
Conclusion
I hope that if you haven’t used debugger yet, you’ll start now. And if you used debugger, you’ve learnt something new. There are plenty of tutorials on the web for each one of the debugger, so if you want to know more about any of them, Google them. If you had any issues or you want to know something more about part of the tutorial, leave the comment in the section below.
#references
- jetbrains.com/ruby/features/ruby_debugger.html
- xdebug.org/docs/install
- gist.github.com/jtdp/5451525
- confluence.jetbrains.com/display/PhpStorm/Xdebug+Installation+Guide
- slideshare.net/AcidumIrae/xdebug-16311854
- youtube.com/watch?v=-Z_7ShOI16M&feature=youtu.be
- blog.jetbrains.com/phpstorm/2013/08/debugger-configuration-validation-with-phpstorm/
- developers.google.com/chrome-developer-tools/docs/elements
- devtools.rootpd.com/
- developers.google.com/chrome-developer-tools/docs/javascript-debugging
- github.com/node-inspector/node-inspector